How Much Does Solar Panel Installation Cost in 2026?
Solar panel installation cost in 2026 runs between $15,000 and $36,000 for most U.S. residential systems before incentives—roughly $2.50 to $3.50 per watt installed. Commercial systems come in closer to $2.00 per watt, though total project costs run higher. The number on your quote depends on system size, roof type, location, and equipment. Here is what actually drives that number.
| System Type | System Size | Cost Before Incentives |
|---|---|---|
| Small residential | 4–6 kW | $11,000–$20,000 |
| Medium residential | 7–10 kW | $18,000–$30,000 |
| Large residential | 11–15 kW | $28,000–$45,000 |
| Commercial | 50 kW+ | $2.00/watt and up |
What Does Solar Panel Installation Cost Per Watt in 2026?
Cost per watt is the cleanest way to compare quotes. Two installers quoting different system sizes are hard to compare on total price alone. On a per-watt basis, the comparison becomes straightforward.
Most residential quotes in 2026 land between $2.50 and $3.50 per watt. Platforms where installers compete tend to cluster around $2.58/watt. A single installer with no competition often quotes closer to $3.50/watt—sometimes higher. According to NREL’s solar cost benchmark data, residential installed prices have dropped over 45% in the past decade. 2026 is genuinely one of the most affordable entry points the market has seen.
Commercial jobs are priced differently. A warehouse client with a $2,400 monthly electricity bill and a large flat roof will get a very different per-watt number than a homeowner with a 2,000 sq ft house. Larger systems spread fixed costs—design, permitting, labor mobilization—across more kilowatts. Below $2.00/watt is realistic for mid-to-large commercial projects.
One thing that changed going into 2026: the federal Residential Clean Energy Credit (Section 25D) expired December 31, 2025. New homeowner-purchased systems no longer qualify. State and local incentives are still out there in many markets—but you have to look for them, they are not automatic.
What Actually Goes Into Your Quote?
System size is the biggest cost driver. A typical U.S. home using 10,000 kWh per year needs roughly 7–8 kW. Add an EV charger or switch to all-electric appliances and that number climbs fast—we have seen homes jump to 12–14 kW just from adding a heat pump and an EV.
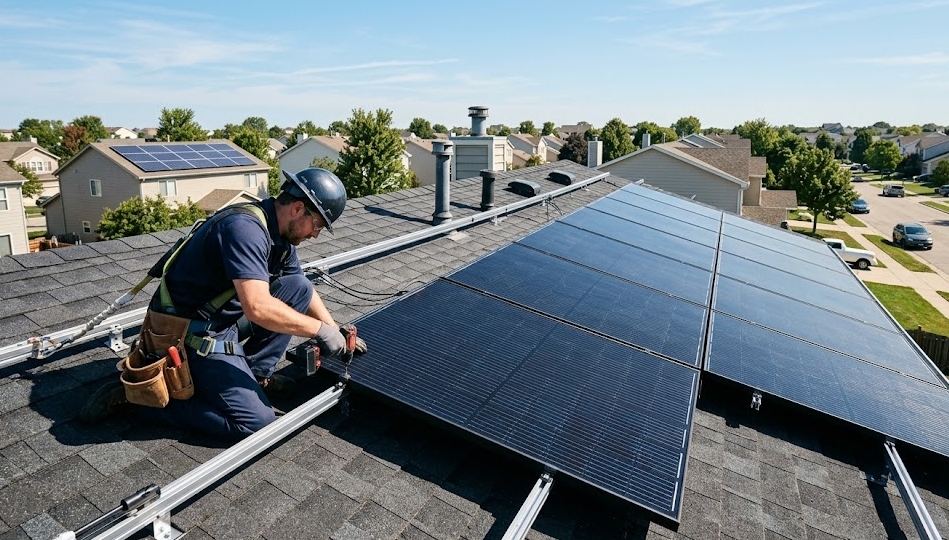
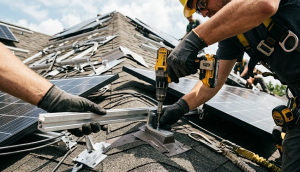
Roof complexity catches people off guard. A straightforward south-facing roof with no obstructions is a half-day job. A house with four different roof planes, a 45-degree pitch, and clay tile? That is a two-day job minimum, and the labor cost reflects it. If the roof needs repair before panels go on, that bill is separate from the solar quote entirely.
Labor costs vary a lot by state. A crew in San Francisco charges more per hour than one in Phoenix—that gap shows up directly in your quote. Permitting adds another layer. Some municipalities charge $200. Others charge $1,200. You will not know until you pull the permit.
Panel type is a real cost lever. Most residential installs today use monocrystalline panels—they cost more upfront but fit more power into less roof space. Microinverters are pricier than string inverters, but on a roof with trees nearby or multiple angles, they keep output from dropping when one panel gets shaded. Battery storage is a separate line item—add $8,000 to $15,000 if backup power matters to you.
Does Going Solar Still Make Financial Sense in 2026?
For a lot of homeowners, still yes. But the numbers look different now.
A system that used to pay itself off in seven years might now take nine or ten. That is a real change worth acknowledging. What has not changed is the long-term electricity bill savings—most homeowners cut $37,000 to $154,000 in utility costs over a 25-year system life. In places like California, New York, and Hawaii, where utility rates keep climbing year over year, the savings hold up even without federal help.
Lease and PPA deals work differently. The company that owns the panels claims the Section 48E commercial tax credit, and some of those savings get passed down as lower monthly payments. If your state does not have strong solar incentives, a lease or PPA is worth pricing out before you commit to buying outright. We have seen clients save $4,000–$6,000 over five years by going the PPA route in states with weak rebate programs.
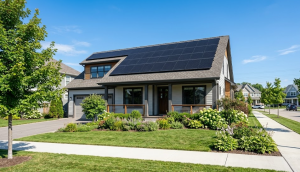
One more number worth keeping in mind: homes with solar tend to sell for 3–5% more. Not guaranteed, but documented across multiple housing markets. If you are planning to sell in the next decade, that added value belongs in your calculation.
How Long Does Solar Panel Installation Take to Pay Back?
Depends on three things: what you paid, what you save each month, and what incentives you actually received.
Under typical 2026 conditions—no federal credit, average electricity rates—most systems pay back in eight to twelve years. High-rate states pay back faster. Low-rate states take longer. A client in Massachusetts with a $0.28/kWh rate and a well-sized 10 kW system will see payback in six to seven years. The same system in a state paying $0.10/kWh might take fourteen.
Monthly savings range from $80 to $250+, depending on system size and local utility rates. That gap compounds significantly over 25 years—do not just look at year one.
At EnergyLZ, we size systems based on actual consumption data pulled from utility bills, not rule-of-thumb estimates. An oversized system costs more upfront and takes longer to pay back—we have seen quotes from other installers that were 30% oversized for the home’s actual usage. Our renewable energy installation services cover residential and commercial projects across multiple states, and every design starts with the same question: what does this specific building actually use?
Solar panel installation cost is a real number with a real return. Get the sizing right, compare quotes on a per-watt basis, and check what state incentives are still active in your area. That is the whole calculation.